import pyvista
import torch
from diffdrr.drr import DRR
from diffdrr.visualization import drr_to_mesh, img_to_mesh

from diffpose.deepfluoro import DeepFluoroDataset
from diffpose.visualization import fiducials_to_mesh, lines_to_mesh3D camera pose geometry
Using PyVista to visualize the 3D geometry of the projection setup
Note
3D plotting in Jupyter can be annoying to set up, not to mention getting it to work on a remote server. Be sure to follow all instructions in the PyVista documentation to resolve common bugs.
If running Jupyter remotely, run the following…
pyvista.start_xvfb()
pyvista.global_theme.trame.server_proxy_enabled = True
pyvista.global_theme.trame.server_proxy_prefix = "/proxy/"pyvista.set_jupyter_backend("trame")
device = torch.device("cuda" if torch.cuda.is_available() else "cpu")# Initialize DiffDRR for Patient 1
SUBSAMPLE = 6.410714285714286
specimen = DeepFluoroDataset(id_number=1)
height = int((1536 - 100) / SUBSAMPLE)
delx = 0.194 * SUBSAMPLE
drr = DRR(
specimen.volume,
specimen.spacing,
sdr=specimen.focal_len / 2,
height=height,
delx=delx,
x0=specimen.x0,
y0=specimen.y0,
reverse_x_axis=True,
bone_attenuation_multiplier=2.5,
).to(device)_, pose = specimen[69]
rotations = pose.get_rotation().to(device)
translations = pose.get_translation().to(device)# Extract a mesh from the CT
ct = drr_to_mesh(drr, method="surface_nets", threshold=145, verbose=True)
# Make meshes for the camera and detector plane and
# convert the DRR into a texture for the detector plane
camera, detector, texture, principal_ray = img_to_mesh(
drr, rotations, translations, "matrix"
)
# Compute the locations of 3D fiducials and projected 2D fiducials
fiducials_3d, fiducials_2d = fiducials_to_mesh(
specimen,
rotations,
translations,
detector=detector,
parameterization="matrix",
)
# Draw lines from the camera to the 2D fiducials
lines = lines_to_mesh(camera, fiducials_2d)Performing Labeled Surface Extraction: 100%|█████████████████████████████████████████████████████████████████████████████████████████████████████████████████████████████████████████████████████████████████████████████████████[00:01<00:00]
Finding and Labeling Connected Regions.: 100%|███████████████████████████████████████████████████████████████████████████████████████████████████████████████████████████████████████████████████████████████████████████████████[00:00<00:00]
Smoothing Mesh using Taubin Smoothing: 100%|█████████████████████████████████████████████████████████████████████████████████████████████████████████████████████████████████████████████████████████████████████████████████████[00:04<00:00]
Filling Holes: 100%|█████████████████████████████████████████████████████████████████████████████████████████████████████████████████████████████████████████████████████████████████████████████████████████████████████████████[00:00<00:00]
Cleaning: 100%|██████████████████████████████████████████████████████████████████████████████████████████████████████████████████████████████████████████████████████████████████████████████████████████████████████████████████[00:00<00:00]Rendering a single X-ray in an interactive window
Exporting a notebook to HTML does not also automatically catch the PyVista plots, so the interactive plot has been manually saved to HTML and loaded.
plotter = pyvista.Plotter()
plotter.add_mesh(ct)
plotter.add_mesh(camera, show_edges=True)
plotter.add_mesh(detector, texture=texture)
plotter.add_mesh(principal_ray, color="red")
plotter.add_mesh(
    fiducials_3d,
    color="blueviolet",
    point_size=7.5,
    render_points_as_spheres=True,
)
plotter.add_mesh(
    fiducials_2d,
    color="lime",
    point_size=5,
    render_points_as_spheres=True,
)
for line in lines:
    plotter.add_mesh(line, color="lime")

plotter.add_axes()
plotter.add_bounding_box()

# plotter.show()  # If running Jupyter locally
# plotter.show(jupyter_backend="server")  # If running Jupyter remotely
plotter.export_html("render.html")
from IPython.display import IFrame
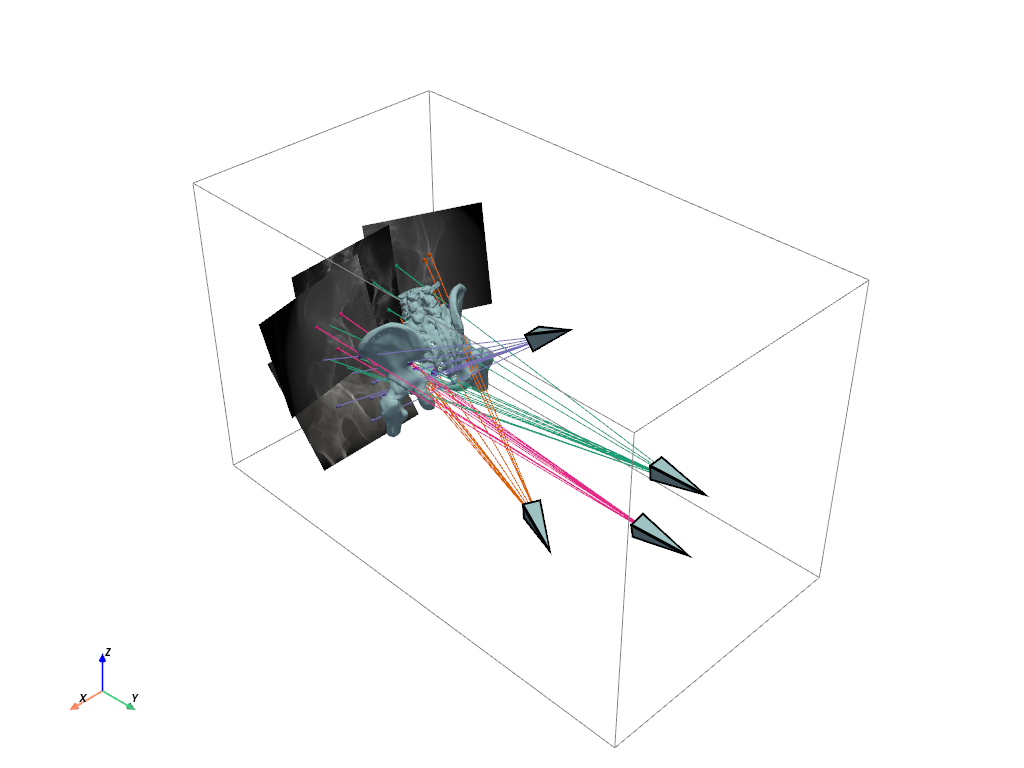
IFrame("render.html", height=500, width=749)Rendering multiple X-rays in a static window
# Initialize the plot with the CT and 3D fiducials (shared across all plots)
plotter = pyvista.Plotter()
plotter.add_mesh(ct)
plotter.add_mesh(
    fiducials_3d,
    color="blueviolet",
    point_size=7.5,
    render_points_as_spheres=True,
)

# Render a subset of the X-rays
for idx, color in zip([0, 2, 69, 100], ["#1b9e77", "#d95f02", "#7570b3", "#e7298a"]):
    _, pose = specimen[idx]
    rotations = pose.get_rotation().to(device)
    translations = pose.get_translation().to(device)

    camera, detector, texture, _ = img_to_mesh(
        drr, rotations, translations, parameterization="matrix"
    )
    _, fiducials_2d = fiducials_to_mesh(
        specimen, rotations, translations, detector=detector, parameterization="matrix"
    )
    lines = lines_to_mesh(camera, fiducials_2d)

    plotter.add_mesh(camera, show_edges=True, line_width=3)
    plotter.add_mesh(detector, texture=texture)
    plotter.add_mesh(
        fiducials_2d,
        color=color,
        point_size=5,
        render_points_as_spheres=True,
    )
    for line in lines:
        plotter.add_mesh(line, color=color)

plotter.add_axes()
plotter.add_bounding_box()
plotter.show(jupyter_backend="static")